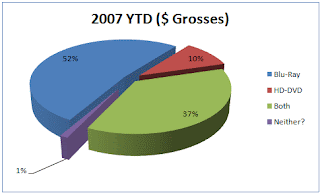
Pie Charts are one of the most common geovisualization instruments on the market today. Pie charts are very easy to interpret and help individuals and companies visualize their data. Pie charts are a step up from the old bar charts that plagued board room discussions and school projects for years. The above pie chart displays the YTD grosses of HD DVD, Blue Ray DVD's and combined grosses of the two.
No comments:
Post a Comment