Thursday, November 20, 2008

Pie Charts


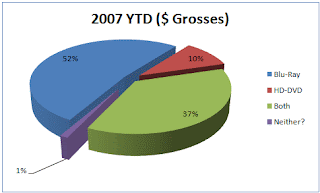
Pie Charts are one of the most common geovisualization instruments on the market today. Pie charts are very easy to interpret and help individuals and companies visualize their data. Pie charts are a step up from the old bar charts that plagued board room discussions and school projects for years. The above pie chart displays the YTD grosses of HD DVD, Blue Ray DVD's and combined grosses of the two.

Bathymetric Map


A Bathymetric Map is a map that accurately depicts all of the various depths of a water body. A bathymetric map or chart usually shows floor relief or terrain as contour lines (called depth contours or isobaths), and may additionally provide surface navigational information. Color-coding to show the different depths of water is a common methodology used in bathymetric maps.

Star Plot


zoonek2.free.fr/UNIX/48_R/03.html

Star Plots are a type of visualization that allow you to compare multiple variables for each observation. Each observation is represented as a star-shaped figure with one ray for each variable. A legend often accompanies a Star Plot to identify what the variables are and in what location (or on what ray) each variable is represented. The star map above describes different soil densities.

Correlation Matrix


The correlation matrix is basic to many kinds of analysis. It is a bridge over which scientists can move from their data to sophisticated statistical analyses of patterns, dimensions, factors, causes, dependencies, discriminations, taxonomies, or hierarchies. Each coefficient measures the degree and direction (sign) of the correlation between the row and column variables. The statistical analysis above shows certain variables (GNP per capita, Trade, Power, Stability,..etc) and how they correlate to one another.

Similarity Matrix


The map above is an example of a Similarity Matrix. This type of map shows the similarity between two data points. Similarity Matrices are used in a sequence alignment. Higher scores are associated with more similar scores. The map above shows a genestic similarity matrix. It was computed using two different formulas in order to produce two similar data points.

Stem and Leaf Plot


mainland.cctt.org/.../images/table2.gif


Stem and Leaf plots are fairly simple to read. The digit(s) in the greatest place value(s) are the data values of the stems. The digits in the next greatest place values are the leaves. For example, if all the data are two-digit numbers, the number in the tens place would be used for the stem. The number in the ones place would be used for the leaf. The plot above is an example of per capita GNP for Western Africa. The way the data is read is 1 : 80 is ahown as 180.

Box Plot


A box plot, or box and whisker diagram, provides a simple graphical summary of a set of data and is a standardized way of displaying the distribution of data based on the five number summary: minimum, first quartile, median, third quartile, and maximum. It shows a measure of central location the median), the average, and measures of dispersion. The plot above shows car mileages grouped by different countries.